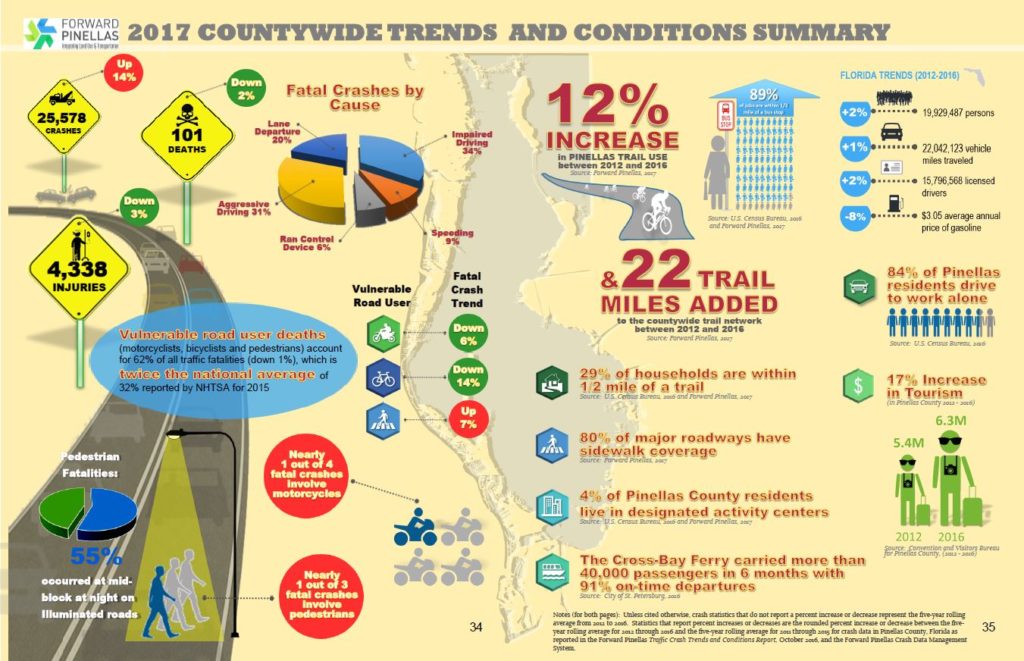
Is traffic congestion getting better or worse in Pinellas County? How many people are using the Pinellas Trail? Are the streets getting safer for pedestrians? If you’ve ever asked questions like these—or just wanted to know more about the current state of transportation —the Countywide Trends and Conditions Report for Pinellas County is for you.
New this year, the report combines and updates two previous inventories of transportation facilities and crash statistics. These findings are used to track progress on countywide efforts to reduce congestion, traffic safety, and roadway design, among others.
The new publication serves the same purpose, but is designed to be less of an inventory and more of conversation about trends in transportation throughout our county. In keeping with the Forward Pinellas mission, the role of land use in transportation choices is also interwoven.
Findings from the report show both positive and negative trends over the past five years. Here are a few key takeaways from the report:
- Of all jobs in Pinellas County, 89 percent are within a half mile of a bus stop. Increasing the frequency of bus service along routes serving large numbers of housing and jobs could make this mode of travel a more viable option for the 55 percent of commuters traveling less than 10 miles to work.
- We knew that the usage of the Pinellas Trail has been steadily increasing, but with automated trail counters installed in January 2017, data collected already shows that previous Pinellas Trail use estimates may have been significantly understated. The number of average daily users was about 5,000 in January and 6,000 in February. If counts continue to be as high even for only half of the year, that would be about 900,000 trail users per year, which is nearly twice the estimates for previous years. The numbers show that the nearly 22 miles of new trails added between 2012 and 2016 are meeting significant demand for pedestrian/bicycle facilities.
- The Vision Zero approach to safety holds that even one traffic death is unacceptable, and fatalities are preventable if stakeholders come together to set measurable goals for safer roadways. Forward Pinellas is working with state and local partners to develop a Vision Zero action plan with the goal of significantly reducing the severity of traffic crashes and eliminating traffic deaths. Pedestrian deaths in Pinellas County accounted for 35 percent of all traffic fatalities, and bicycle crashes accounted for six percent of all traffic fatalities – and both percentages are twice the national average, illustrating the need for the action plan and changes in how we design our transportation networks.
- We need to adapt to emerging trends that will affect land use and transportation in the future, such as innovations in technology that help prevent distracted driving crashes. Distractions resulting from a driver’s cell phone, navigation device, external distraction, general inattentiveness or other activity were responsible for 2,587 crashes in 2016, up 22 percent from the previous year. Of all crashes, one out of 10 involved distracted driving.
- Traffic congestion, as measured by traffic volume vs. the capacity the road was designed for, has increased by five percent overall (although some individual roads have decreased), and total motor vehicle crashes countywide have gone up 14 percent. The fact that crashes are increasing at almost triple the rate of congestion indicates something else at play – further indicating the need for distracted driving to be a bigger focus of safety improvement efforts.
The findings from this report will help Forward Pinellas, our member local governments, and our partner agencies evaluate our collective progress to expand safe, convenient options for multimodal travel in Pinellas County—and, we hope, spark some new community conversations about the future of transportation.
In our performance-based, outcome-driven transportation planning process, we will soon be setting targets for what we expect to achieve with our transportation investment strategies. This report provides a good baseline to identify the most important measures and meaningful targets that will guide how we spend our transportation dollars in the future.


Traffic light synchronization is awful; other day I drove Belcher from E Bay to 38 Ave N and stopped at EVERY light, traffic was moderate and I drove the speed limit (that was probably a mistake). Item 2; bicycle lanes on roadways are an accident waiting to happen…been there done that, way too dangerous. Better idea, smooth the sidewalks. Currently most sidewalks are so rough that the average bicycle, with more than 60#s pressure in tires, the peddler is getting beat to death. I ride my bicycle to work daily, and for pleasure, but the sidewalks are becoming more punishing…don’t need to rebuild them, don’t have the money to do that, just grind ’em smooth
I formed the MPO BAC back in 1983 and participated all 35 yrs . Looking at both bike and ped acc/fatalities records , it jumps out to me that 99% are in the dark .We have all done a wonderfull job of improving design and facilities , but poor job of lighting the sites of these accidents .
In same vain , very few of the stats we get will show the time of day of the acc…….lets make the time of day/lighting issue a priority for 2018 . Bert Valery
See above .