What do you think about making our streets safer? Where are our problems? Do you know others who may have ideas?
Earlier this year, Forward Pinellas announced the kickoff summit for Safe Streets Pinellas, our Vision Zero effort. Like many other events, the summit, scheduled for March, was postponed. But our work to make our streets safer for everyone continues. Over the past couple months, our Safe Streets Pinellas team, including a task force of 16 members that includes representatives of schools, local businesses, community leaders, and engineering communities, has been working to better understand where our streets most need our attention.
Now we need your help!

Over the next eight weeks, we are taking our #SafeStreets Summit virtual! From an online, interactive comments map and fun trivia questions, to art contests and online pledges, there will be many opportunities for you to tell us why #SafeStreets matter to you and where you’re seeing transportation issues. Each week, we will have opportunities for you to engage with new materials, and after you complete activities (and let us know about it), you can enter into a random drawing for a prize. For every submission and tag on social media, you can be entered into a random drawing at the end of the eight weeks for range of items, from a bike shop gift card to tote bags. You can stay up to date on the latest activities by following our blog, social media, or visiting the Safe Streets webpage.
We’ll be using the feedback we hear from you to help develop and implement an Action Plan. The Action Plan will identify areas of concern and will provide tools to help us make our community safer for everyone while traveling. We’ll also be developing measures of success as we work towards our ultimate goal of zero deaths and serious injuries on our streets.
One of our early #SafeStreets efforts has been to look at where people have been killed or seriously injured on our roadway network and learn more about the crashes.
For example, on average, two people are killed or seriously injured (KSI) on our streets every day.
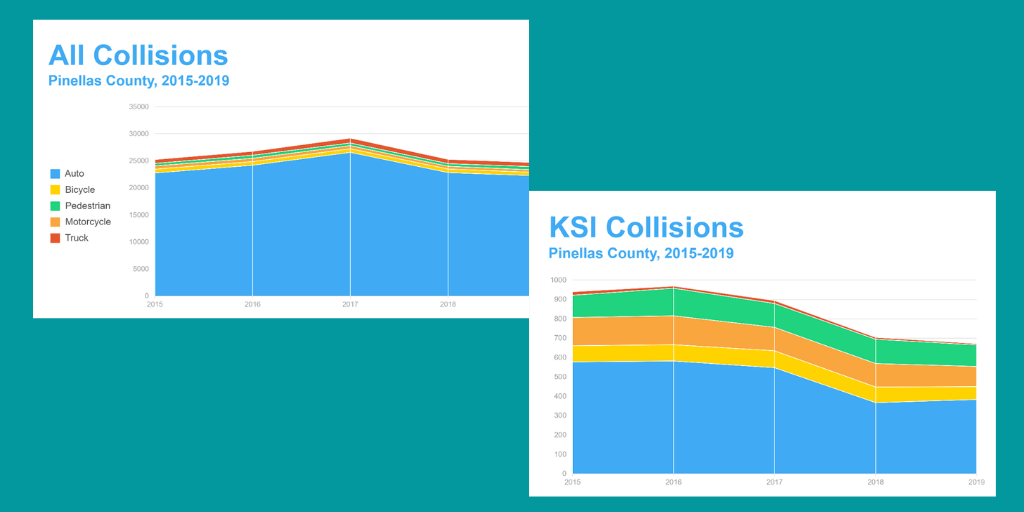
The graphs below show the number of collisions in Pinellas County, how many are fatal or result in a serious injury, and how many involve automobiles, pedestrians, bicyclists, motorcycles and trucks.

Over 4,000 collisions from 2015 through 2019 resulted in a death or serious injury. Many of these involve a vulnerable roadway user – a pedestrian, bicyclist or motorcyclist. The number of KSI collisions is down, but we are still seeing nearly 700 of these collisions a year. This takes an emotional and financial toll not only on the people directly involved in the collision, but on the overall community. We’ve started to look at factors such as where the collisions are happening (such as at an intersection), what time of day or year collisions are more likely to occur, the ages of those involved, if they include a DUI, etc., to help us better understand the data and what strategies would work best to get to zero deaths or serious injuries.
We’ve put together a Story Map that helps us to dive deeper into where our more serious problems are located.
If you’re interested in data and details, we welcome you to explore the Story Map and the data we’ve already started to analyze. In the Story Map, you can see where collisions are happening involving people walking, intersections with multiple fatal collisions and also where these areas are in relation to communities of concern, among other things. Take a picture of the story map and submit this form or tag us – @fwdpinellas- to enter into the drawing!

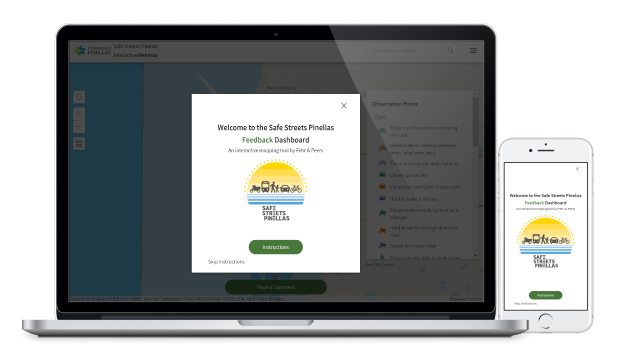
We know that reported data can only tell us so much. We all know of “near misses,” places we avoid because we feel they are unsafe, and people who have experienced crashes and not reported them. Forward Pinellas is looking for your help in identifying these places. We’ve developed an interactive map where you can tell us what you see, including placing dots, drawing lines, adding pictures and upvoting places that other people have identified.
We recognize that people are traveling differently these days. We welcome your thoughts both on what places or patterns you saw before COVID-19 and what you are seeing now.
Once you use the map, be sure to let us know to be entered into the drawing!
This is our first step in working with the community to address this serious concern. We look forward to working with you as we develop a high injury network and hotspot locations, test out demonstration projects, develop a toolbox of countermeasures and an action plan. Once we have the action plan, we look forward to working with our partners to implement it and help get us to zero.


